

Executive Summary:
Currently, Long Beach is a well-diversified economic region with substantial growth potential. Its sector portfolio includes several clusters and sectors with cluster potential. However, Long Beach, as everyone else, faces a major threat that will substantially alter that picture:
Within the region, more than 50% of all jobs are at risk of automation. Even when taking current employment projections into account, Long Beach may lose up to 40% of its current jobs. Extraordinary efforts are required to reduce job losses as well as accommodate entirely new jobs, including those in industries that may not yet exist.
Long Beach is still expected to come out ahead of most other locations in the United States as it will benefit from its well diversified sector structure.
The report details current and expected future strengths, namely its cluster sectors, income potential, and diversification. It exposes its weaknesses as well, which it identifies as the lack of flexibility and available business services. It concludes with economic policy recommendations and suggestions for next steps.
Overview:
This report analyzes the effect of automation on the Long Beach Economic Region.
It first summarizes its current economic structure, strategic positioning, and risks as reference points. It then presents the expected future economic structure and strategic positioning and discusses future risks based on the technical automation potential of industrial sectors.
The report uses historical performance of sectors in the selected region to project future scenarios. Each section on the current status is immediately followed by an analysis of the expected changes due to automation.
After reading this report, decision makers will be able to answer questions like:
· What does the sectoral structure and economic geography within the Long Beach economic region look like?
· Which zip codes have performed well, and which ones have underperformed?
· How well is each sector positioned in Long Beach, relative to the United States?
· What is the growth and income potential of each sector?
· How large is the strategic risk for the Long Beach area if key industrial sectors start to decline?
· How much will the area likely be affected by the next recession?
· How will the expected automation affect the answers to all the above questions?
The answers to these questions provide decision makers with guidance for economic development. They also provide directions for infrastructure investment, real estate development and targeted lending decisions.
They form a basis to evaluate whether local policies, efforts, workforce training, and incentives are sufficiently geared towards their region’s strategic industrial sectors.
They indicate which policies, efforts, and sectors decision makers should focus on to ride out the expected automation storm.
This analysis can also be used to guide regional marketing campaigns to emphasize a region’s true strengths. It is designed as a resource to develop the strengths required to better prepare for the future.
Our scenarios are calculated under the assumption that all employment that can be technically replaced by automation will be automated. While these are unlikely scenarios, they serve as an excellent point of reference for three reasons:
1. They only take currently known and expected automation technology into account as outlined in Frey and Osborne (2017).
2. They do not need to rely on any additional assumptions.
3. Lower levels of automation can be visualized by shifting points between the current situation and the full automation situation in the graphs.
The economic area we analyzed, consists of the following zip codes: 90802, 90803, 90804, 90805, 90806, 90807, 90808, 90810, 90813, 90814, 90815, 90822, and 90840. These zip codes are located in Los Angeles County in California.
The total private non-farm employment based on our estimates as of May 2016 is 179,800. If employment growth continued at the current pace, total employment would reach 199,000 after ten years and 251,800 after twenty years.
However, if all the job automation potential was realized within the next ten years, this number would drop steeply to 89,250, representing a 50% drop. If it took 20 years to fully realize the automation potential, total employment would still drop sharply to 114,500.
Employment growth in the region during the last year was 2.7%, the five-year compound growth rate is 3.0%, and the ten-year compound growth rate is slightly negative at -0.13%. If all automation potential was realized within the next ten years, employment growth would then be negative 6.8%, if it would take longer and would only be realized within in the next twenty years, this number would change to negative 2.2%. These numbers include projected employment growth based on estimates of the Bureau of Labor Statistics.
It does not include potential job creation of entirely new industries unknown to us today. While it is unlikely that all automation potential will be realized, it seems equally unlikely that Long Beach will have no job automation, or that it will experience a shrinking population. As compared to labor projections without automation, Long Beach faces the threat of losing almost 54% of its current jobs to automation by 2035.While not all jobs that are automatable will be automated, it appears prudent for Long Beach to prepare for substantial change in their sectoral composition if not a situation of both economic and social distress.
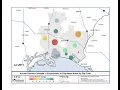
Map 1a below shows employment growth during the last year by zip code. Green circles indicate positive job growth, grey circles stagnant zip codes, and yellow or red circles job losses. The circle size represents the number of jobs within a zip code.

Map 1a: Year-over-Year Employment Growth
Employment growth over the last five years is documented in the following animation:
Animation 1: Year-over-Year Employment Growth, May 2011 through May 2016
Animation 1 above reveals that growth was only uniform across zip codes for the last year of the analysis. With few exceptions, port areas thrived, whereas inland areas tended to fluctuate more. This indicates that where things are produced within a region (the geographic composition of economic activity) is an important factor for ensuring balanced regional economic growth and development.
Next, we calculate what annual employment growth rates would look like if all automation potential was realized within ten years. While this scenario may be unrealistic, it indicates which zip codes within Long Beach may need attention earlier than others. We calculate expected annual employment growth as compound annual growth rates (CAGR), meaning the average growth rate, from one year to the next over a specific time. This scenario is expected to look as follows:

Map 1b: Compound Annual Employment Growth in a Ten-Year Automation Scenario
Our twenty-year automation scenario, which portraits average annual employment growth (CAGR) by zip code if all automation potential was realized within 20 years, is expected to look as follows:

Map 1c: Compound Annual Employment Growth in a Twenty-Year Automation Scenario
Map 1c above clearly indicates the regions expected to be hardest hit (red and orange circles) and distinguishes them from those that are expected to see not much change in aggregate employment (grey circles). Potential changes in infrastructure and retraining are likely largest in the red and orange areas.
Map 2a below shows the numbers of jobs added and lost across sectors for each zip code within a one year period. Green circles indicate jobs created, red circles jobs lost. Brown circles indicate job churn: jobs lost that were compensated for by job growth in other sectors. Green rings indicate net job growth, red rings net job losses, with job churn displayed in the center of the ring.

Map 2a: Jobs Gained and Lost
Map 2a above clearly shows that all zip codes experienced net job growth in the last year. However, they all experienced some level of job churn as well, many of them at large levels, indicating substantial sectoral restructuring. Smaller zip codes (in terms of employment), tended to show larger churn, as did zip codes to the north of the 405 Freeway.
Patterns of job churn during the last five years are documented in the following animation:
Animation 2: Year-over-Year Jobs Gained and Lost, May 2011 till May 2016
Animation 2 above shows how much of the growth or decline in jobs by zip code was due to net addition or net subtraction due to sectoral or geographic restructuring. A surprisingly large amount of job growth happened through churn – constant restructuring of economic activity across sectors.
For a densely-populated area such as Long Beach, this is almost the only way to grow employment. Jobs with low productivity per sqft are replaced with those of higher productivity per sqft. For example, replacing a warehouse (which employs only a few workers) with an office building (which employs far more people) increases the density of employment and income. The animation supports the hypothesis that Long Beach has been successful in constant restructuring to its advantage.
In our ten-year automation scenario in Map 2b below, average job gains versus job losses by zip code are expected to look as follows:

Map 2b: Average Year-Over-Year Job Gains versus Losses in a Ten-Year Automation Scenario
In the ten-year scenario, all zip codes in the Long Beach area would see substantial net losses. Some of the zip codes, however, show brown centers, indicating some job growth in certain sectors. However, about half or all zip codes are not expected to see any sectoral growth at all.
In our twenty-year automation scenario in Map 2c below, average job gains versus job losses by zip code are expected to look as follows:

Map 2c: Average Year-Over-Year Job Gains versus Losses in a Twenty-Year Automation Scenario
In the twenty-year scenario, only about a quarter of the zip codes would see no new jobs. Roughly three quarters are expected to create some new jobs in existing industries, with one zip code expected to see new job creation to outpace job losses.
Note that these scenarios do not include the potential for jobs created in entirely new industries, as any inclusion of industries that do not even exist would be purely speculative. Moreover, infrastructure and retraining facility adjustments can only be made for existing industries, not unknown potential future industries.
The following two tables show growth patterns over the last decade (Table 1a) and for two future scenarios (Table 1b). Both tables list the ten sectors that make up the local economy. Aside from current sector size, we calculate short term (one year), medium term (five year), and long term (10 year) job growth rates. The medium and long-term growth rates are calculated as compound annual growth rates (CAGR), reflecting the average percentage change per year during that time period.

Table 1a: Historical Sectoral Growth May 2006 to May 2016
Table 1a provides the following insights:
· The largest sectors in Long Beach are Trade, Transportation and Utilities, Education and Health Services, and Leisure and Hospitality.
· In the last five years Education and Health Services, and Leisure and Hospitality contributed substantially to job growth. Specifically, Leisure and Hospitality has shown persistent growth rates. A small sector, Mining and Logging showed the highest long run growth. The most recent dip in this sector, however, indicates that it is worthwhile monitoring sectoral development.
· In the last decade Leisure and Hospitality has shown substantial ongoing growth, even accelerating over the last five years. This is in contrast to the largest sector – Trade, Transportation, and Utilities, which has been rather stagnant.
Other noteworthy sectors are Manufacturing with substantial losses during the last decade and Information Services, which has seen rapid employment growth recently. The substantial increases in Professional and Businesses Services during the last five years provide hope as this is a key sector for supporting other sectors and has been shown to help during sectoral transitions.
In table 1b below, we provide calculations for two scenarios: What sectoral employment distribution should we expect if all automation potentials across sectors were to be realized within a) 10 years or b) 20 years?
Both scenarios assume that sectors continue to grow at their historic 5-year compound annual growth rates. Those are adjusted for changes to occupational composition in accordance with the Bureau of Labor Statistics Projections.
Note that it is unlikely that all currently known or expected technological automation possibilities will be realized. Moreover, new industries will emerge that we have no knowledge of at this point, we may also see new technologies appear that may accelerate automation. Consequently, the numbers should not be taken literally, but provide insight in currently expected structural changes. While actual numbers will not be accurate, the direction of sectoral change as well as relative size of sectors will likely be captured by those projections.

Table 1b: Sectoral Growth in Future Automation Scenarios
Table 1b above provides the following insights:
· The largest sectors in our twenty-year scenario in Long Beach are expected to be, in this order, Education and Health Services, Trade, Transportation and Utilities, and Professional and Business Services.
· Education and Health as well as the Information sector are expected to be least affected by automation. Trade, Transportation and Utilities and Leisure and Hospitality are expected to lose the most jobs.
· Mining and Logging is expected to grow the fastest. Currently, the largest sector – Trade, Transportation, and Utilities, is expected to lose its leading position to Education and Health Services.
· Other noteworthy sectors are Construction and Other Services for which our scenarios show slow growth or slow decline.
It is clear from the scenarios that the technology shock from automation will be the smaller the longer it takes for technologies to be implemented.
Historical Structural Change:
There has always been structural change in the Long Beach economy, but it has usually been slow. Additionally, while some changes in relative importance of sectors have been permanent, others have been only temporary.
Figure 1a illustrates this observation. It displays the share of employment from each sector from 1990 to 2015. As such, it complements the analysis presented in Table 1b.

Figure 1a: Employment Shares for 10 Sectors over Time
Education and Health Services has grown in importance over the last 20 years. Other sectors, such as Trade, Transportation and Utilities saw their importance fluctuate, with a more prominent role around the turn of the millennium. Remarkably, Manufacturing employment has seen declines, but has proven steady in its importance. The Information sector, however, while small relative to others, further declined after the Dot-Com bubble burst. It remains to be seen whether the most recent upswing in this sector is sustainable.
We now compare the current distribution of sectors with the expected distributions in the 10-year and the 20-year automation realization scenarios:

Figure 1b: Distribution of Sectors Currently and Post Automation
Figure 1b combines information from tables 1 and 2 and illustrates the changes that automation could bring to Long Beach employment.
In both scenarios, without the creation of entirely new jobs in professions that we don’t know yet, employment would fall drastically. The graph clearly illustrates the relative stability of Education and Health Services. The Trade, Transportation, and Utilities, Manufacturing, as well as Leisure and Hospitality sectors are expected to collapse. Mining and Logging as well as Construction will see a relative increase in importance. It also shows that slower technological adoption reduces the shock in absolute terms.
Let us reiterate that these scenarios illustrate automation risks that the current and expected future workforce in currently existing industries face. The projections assume that all currently known or expected automation potentials are going to be realized and that automation does not create any additional jobs. Both assumptions are unrealistic. However, starting from these baseline scenarios, one can modify these assumptions to arrive at more realistic scenarios.
Those modifications, however, may go in both directions; up, as well as down.
· Advances in robotics may increase repatriation of production from overseas locations, thus helping manufacturing but hurting logistics.
· If point-of-sale and point-of-use production replaces large integrated manufacturing plants, both manufacturing and logistics may be hurt.
· Reductions in sales costs could, however, help the increase in retail outlets, which may then increase logistics operations.
These effects need to be evaluated individually, cooperatively, and locally on the industry level, not at the sector level. Due to those uncertainties, we will continue to present our results referencing our two baseline scenarios.